
Usage and cost
See what your sessions spent, by day, model and project, from the session files on your computer.
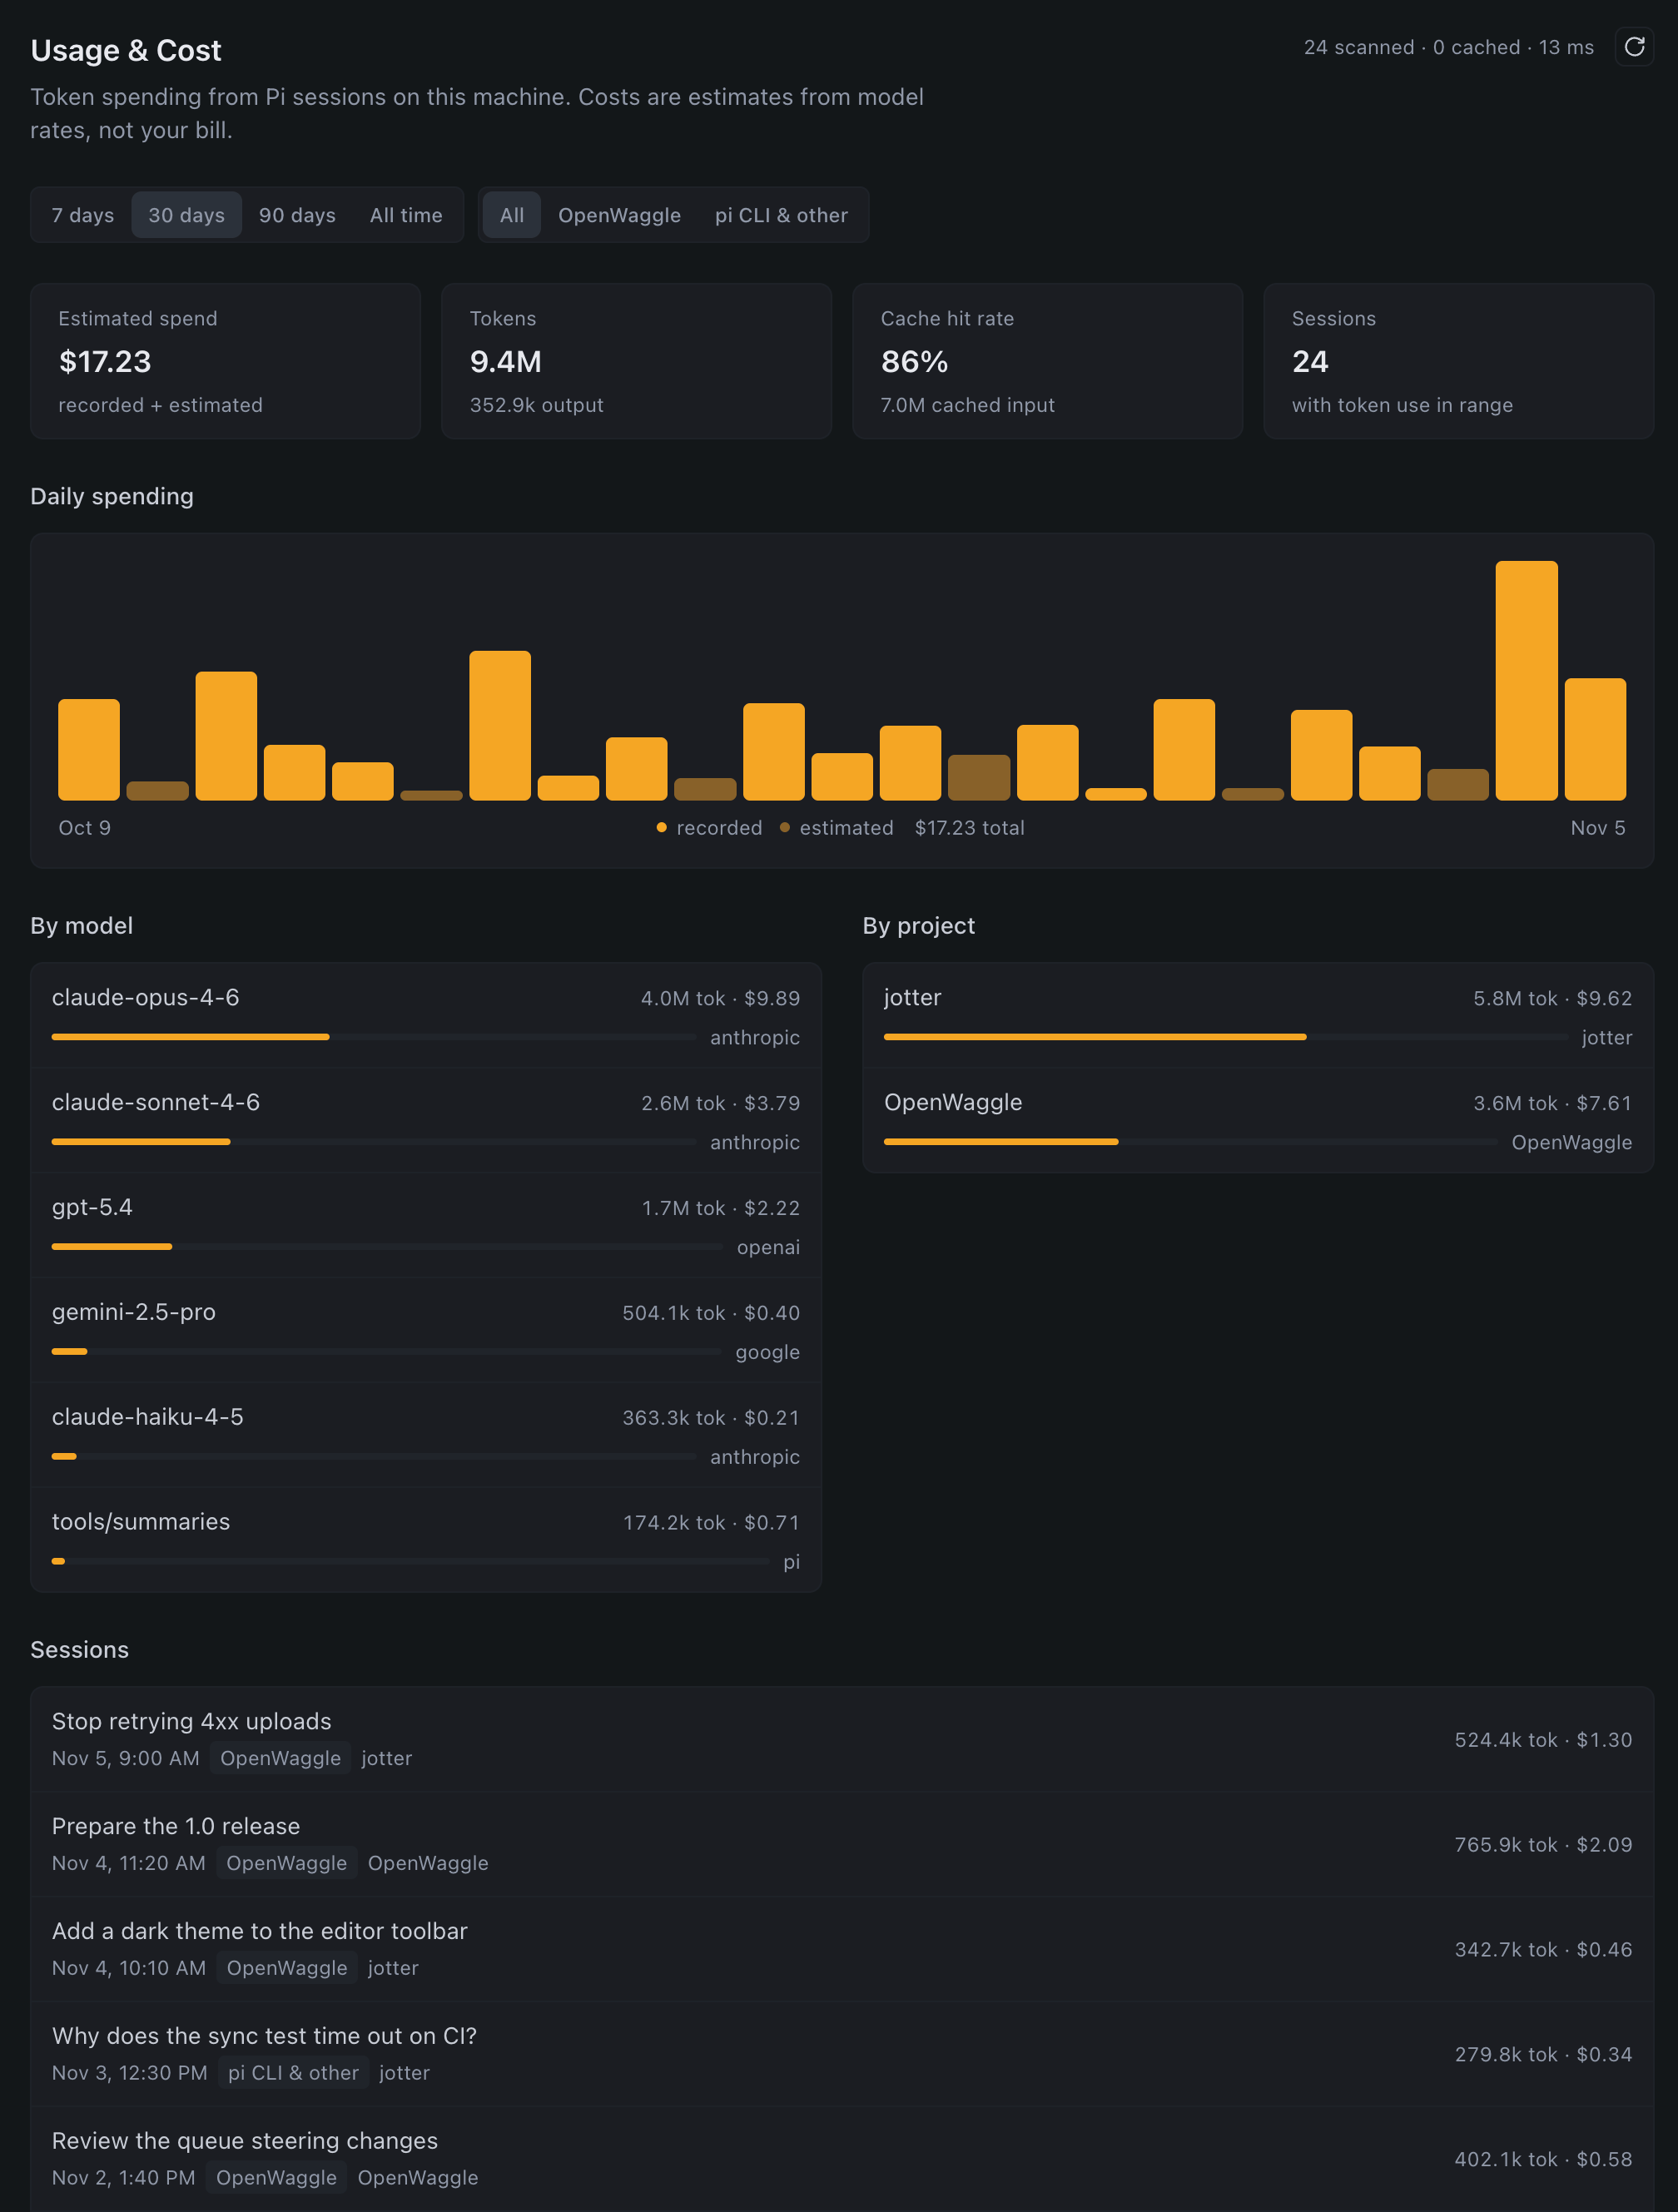
The Usage & Cost page shows how many tokens your sessions used and roughly what they cost, by day, by model and by project. Open it when you want to know where your spending goes, or which session used up a day’s budget. It counts every session in Pi’s sessions folder, the ones from OpenWaggle and the ones from pi in a terminal, and it reads them from the session files on your disk.
Open Usage & Cost
Click the chart button at the right of Settings, at the bottom of the sidebar:

The page fills the window. Choose Back to app at the top left to return.
Read the totals
Four cards at the top sum up the range you picked:
| Card | What it shows |
|---|---|
| Estimated spend | The total cost, and whether it was recorded, estimated or both. |
| Tokens | All tokens used, with the output tokens below. |
| Cache hit rate | The share of input tokens read from the provider’s prompt cache, with the cached input below. |
| Sessions | How many sessions used tokens in the range. |
A session counts in Sessions when it used any tokens, even if it has no cost, for example with a model that has no price. If nothing used tokens in the range, the page says No spending in this window instead of showing charts.
Recorded and estimated cost
The cost comes from two places:
- Recorded cost is what Pi wrote in the session file when the model answered.
- Estimated cost is worked out from the prices in Pi’s built-in model catalog when the file has no cost for a reply. Models you add yourself in
models.jsonare not in that catalog, so their replies without a recorded cost have no price.
Tokens from a model Pi has no price for are left out of the cost. When that happens, a note under the cards says what share of the tokens have no price, and that the cost shown is a floor. In the lists, est. beside a model or project means all its cost is estimated.
All of these are estimates from model prices, not your bill. Your provider’s bill has the final say.
Filter by date and origin
Use the two button groups above the cards:
- The date range: 7 days, 30 days, 90 days or All time. The page opens on 30 days.
- The origin: All, OpenWaggle, or pi CLI & other for sessions started outside OpenWaggle. The page opens on All.
Find where the spending went
Daily spending has one bar per day with spending. The dimmer part of a bar is estimated cost, and hovering a bar shows its date, cost and tokens. With more than 60 such days, the chart shows only the most recent 60, but the lists below still cover the whole range.
By model and By project list the models and projects with the most tokens first, each with its tokens, cost and share. Each list shows 12 rows. Narrow the selection to see the rest. A session in a worktree counts toward the project the worktree belongs to. Sessions from a temporary folder are grouped as Temporary directory, and sessions without a folder as Unknown location. The tools/summaries row, listed under pi, holds usage that belongs to no single model, such as model calls from scripts and summaries.
Click a day, a model or a project to narrow the session list to it. You can combine one of each, and clicking the same item again removes it. Clear selection removes them all.
Find a session
The Sessions list under the charts shows the sessions in your selection, most recently active first. With a selection, its heading reads Sessions in selection and a line above it sums up what you picked. Each row shows the session’s title, when it started, whether it came from OpenWaggle or pi CLI & other, its project, and its tokens and cost. The list shows 20 sessions. Narrow the selection to see the others.
Keep the numbers current
The page scans your session files when it opens, and again every minute while it is visible. Click the refresh button at the top right to scan now. Beside it, the page shows how many files it scanned, how many it took from its cache because they hadn’t changed, and how long the scan took. The footer says when the numbers were last updated.
If the scan fails, the page says Usage & Cost is unavailable. Choose Try again to scan again.
What it reads
Usage & Cost reads the session files in the sessions folder of Pi’s agent folder, ~/.pi/agent/sessions unless PI_CODING_AGENT_DIR moves it. Sessions you keep in another folder with PI_CODING_AGENT_SESSION_DIR or Pi’s sessionDir setting are not counted.
Everything happens on your computer. The page reads only files already on your disk, and nothing it shows leaves your computer. It isn’t related to OpenWaggle’s anonymous usage statistics, which are a separate feature with their own setting.
To see the tokens and cost of the session you have open, hover its context meter. See Context management.