Visualizations
Ask the agent for an interactive chart or diagram and use it in the conversation.
The agent can draw an interactive visualization right in its reply: a chart of your data, a diagram that moves, a small simulation you can adjust, or a mockup of a screen. Use one when you would understand something faster by seeing or trying it than by reading about it. You can also click through a prototype or pick from a set of options, and the agent sees what you chose. Visualizations come from a skill built into OpenWaggle, Visualize, so there is nothing to install.
Ask for a visualization
Describe what you want to see. For example:
Show me how the 4xx retry fix changed upload retries in jotter.To make sure the agent uses the skill, type /visualize in the message box and choose Visualize from the menu. It shows as a chip on your message. The agent may also draw one on its own when a picture explains the answer better.
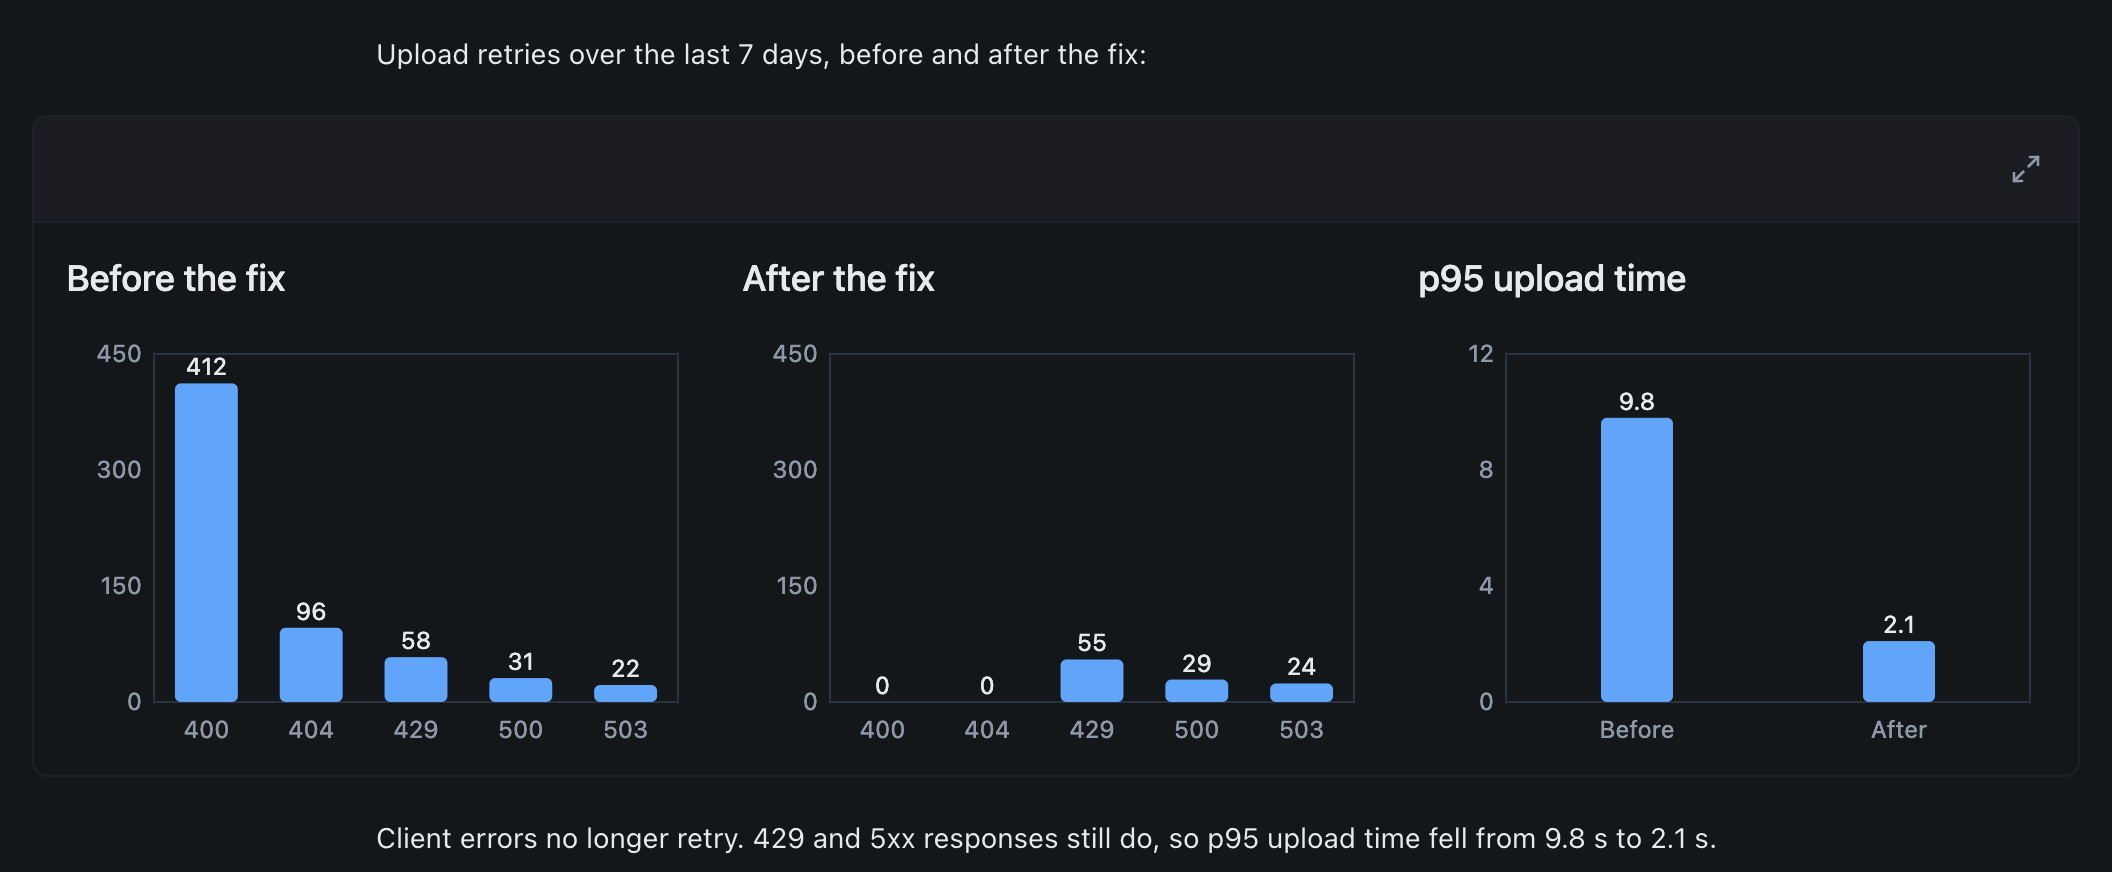
The visualization appears in the reply, where the agent put it. For that request in the jotter project, it is a chart of upload retries by status, before and after the fix:
The agent doesn’t draw a visualization for everything:
- A table you ask for comes back as an ordinary Markdown table.
- A static structure that boxes and arrows fully explain, such as a dependency graph, comes back as a Mermaid diagram in the reply.
- A request for a file, page or component in your project is project work, so the agent builds it in your project instead.
What it can draw
- Charts and plots of numbers, with tooltips, legends you can click and axes with units.
- Maps, drawn from published map data rather than by hand.
- Interactive explainers and simulations, with sliders, buttons or steps you control.
- Timelines, grids and diagrams.
- Mockups of an app screen, dialog or component, styled like the product rather than like OpenWaggle.
- Pickers and checklists you choose from, with a button that sends your choice to the agent.
A visualization follows the app’s light or dark appearance and its reduced motion setting. It grows to the height of its content.
Use a visualization
Work with the controls inside it as you would on a web page: move a slider, pick a tab, hover a point for its value. Your choices stay inside the visualization. Nothing is sent to the agent until you send a message.
When you do send a message, OpenWaggle includes the state of the one visualization that reported a change most recently, usually the one you just used, so you can ask “why does it jump at 8?” and the agent knows what you were looking at. A visualization that has just loaded, such as a new one in the agent’s reply, reports its state too. The state is at most 16 KiB. The agent gets it with that one message only, and treats it as information from the page, not as instructions from you.
Open it large
A visualization made for a wide layout, such as a full app mockup or several charts side by side, has an Expand visualization button at its top right. In the conversation it is up to 1,024 pixels wide, and the button opens it over the whole window:
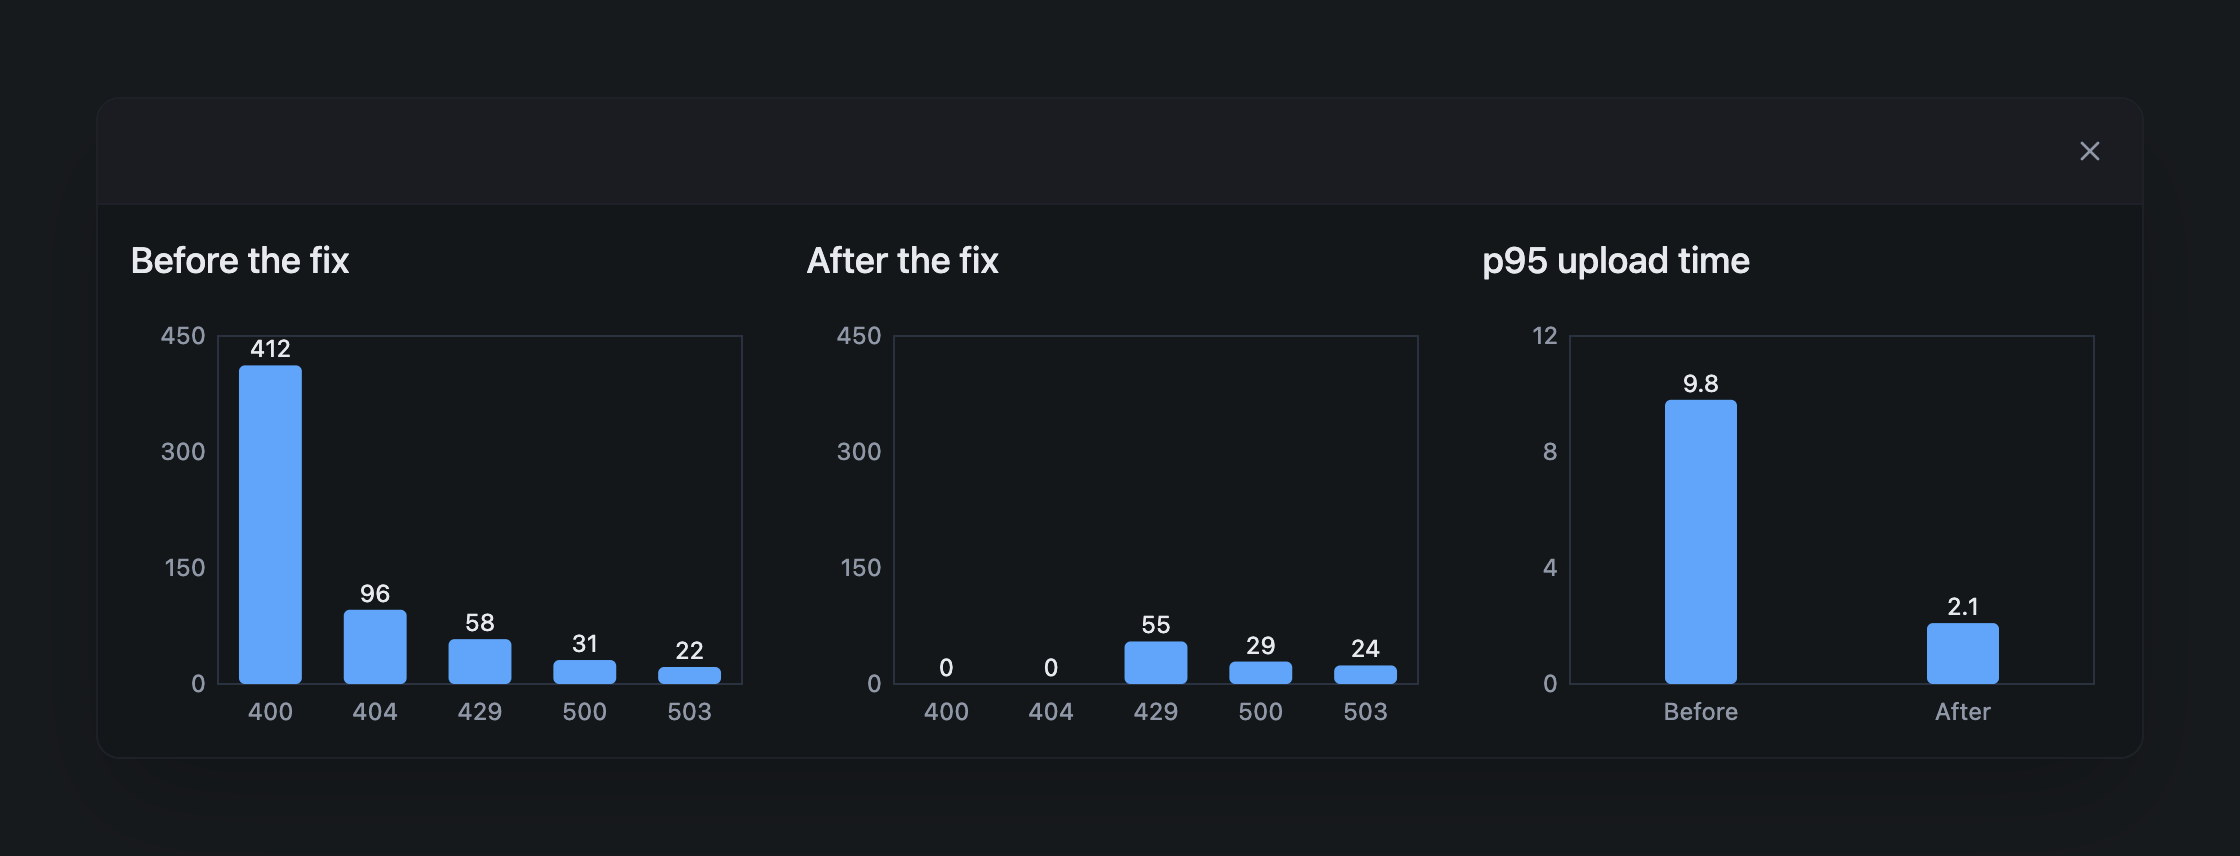
To close it, click × in the corner, press Escape, or click outside it. Visualizations at the normal width have no expand button.
Scroll away and come back
To keep the app fast, OpenWaggle unloads a visualization when you scroll more than 400 pixels past it, and loads it again when you come back. If the visualization reports its state, it comes back the way you left it while the app stays open.
Once you click into a visualization, OpenWaggle pins it. It stays loaded when you scroll away, so nothing you did in it resets. The 3 visualizations you used most recently stay pinned, and an older one unpins when you use a fourth.
Let a visualization send a message
Some visualizations have a button that asks the agent about what you selected, such as “Explain this spike”. When you click it, OpenWaggle shows the message in a dialog before anything is sent. The dialog’s title is the visualization’s own wording, or Send follow-up message?. Choose to send it, and the message goes to the session as if you had typed it, with the visualization’s state. If the agent is busy, it waits in the queue as a follow-up.
A visualization can only ask to send a message right after you click or type in it, and only one at a time. OpenWaggle refuses a message longer than 50,000 characters.
Work through a choice with the agent
Because a visualization’s state goes with your next message, and its buttons can send one for you, you can use it to work something out with the agent:
- Try a prototype. Ask for a clickable mockup of a screen or a flow. Click through it, then ask about or change “this screen”.
- Pick from a set. Ask for the options as tiles or a checklist, with a button. Pick the ones you want and click the button. The message names what you picked.
- Tune values. Move sliders until the result looks right, then ask the agent to use those values in your code.
- Compare options. Ask for the alternatives side by side, choose one, and say “go with this one”.
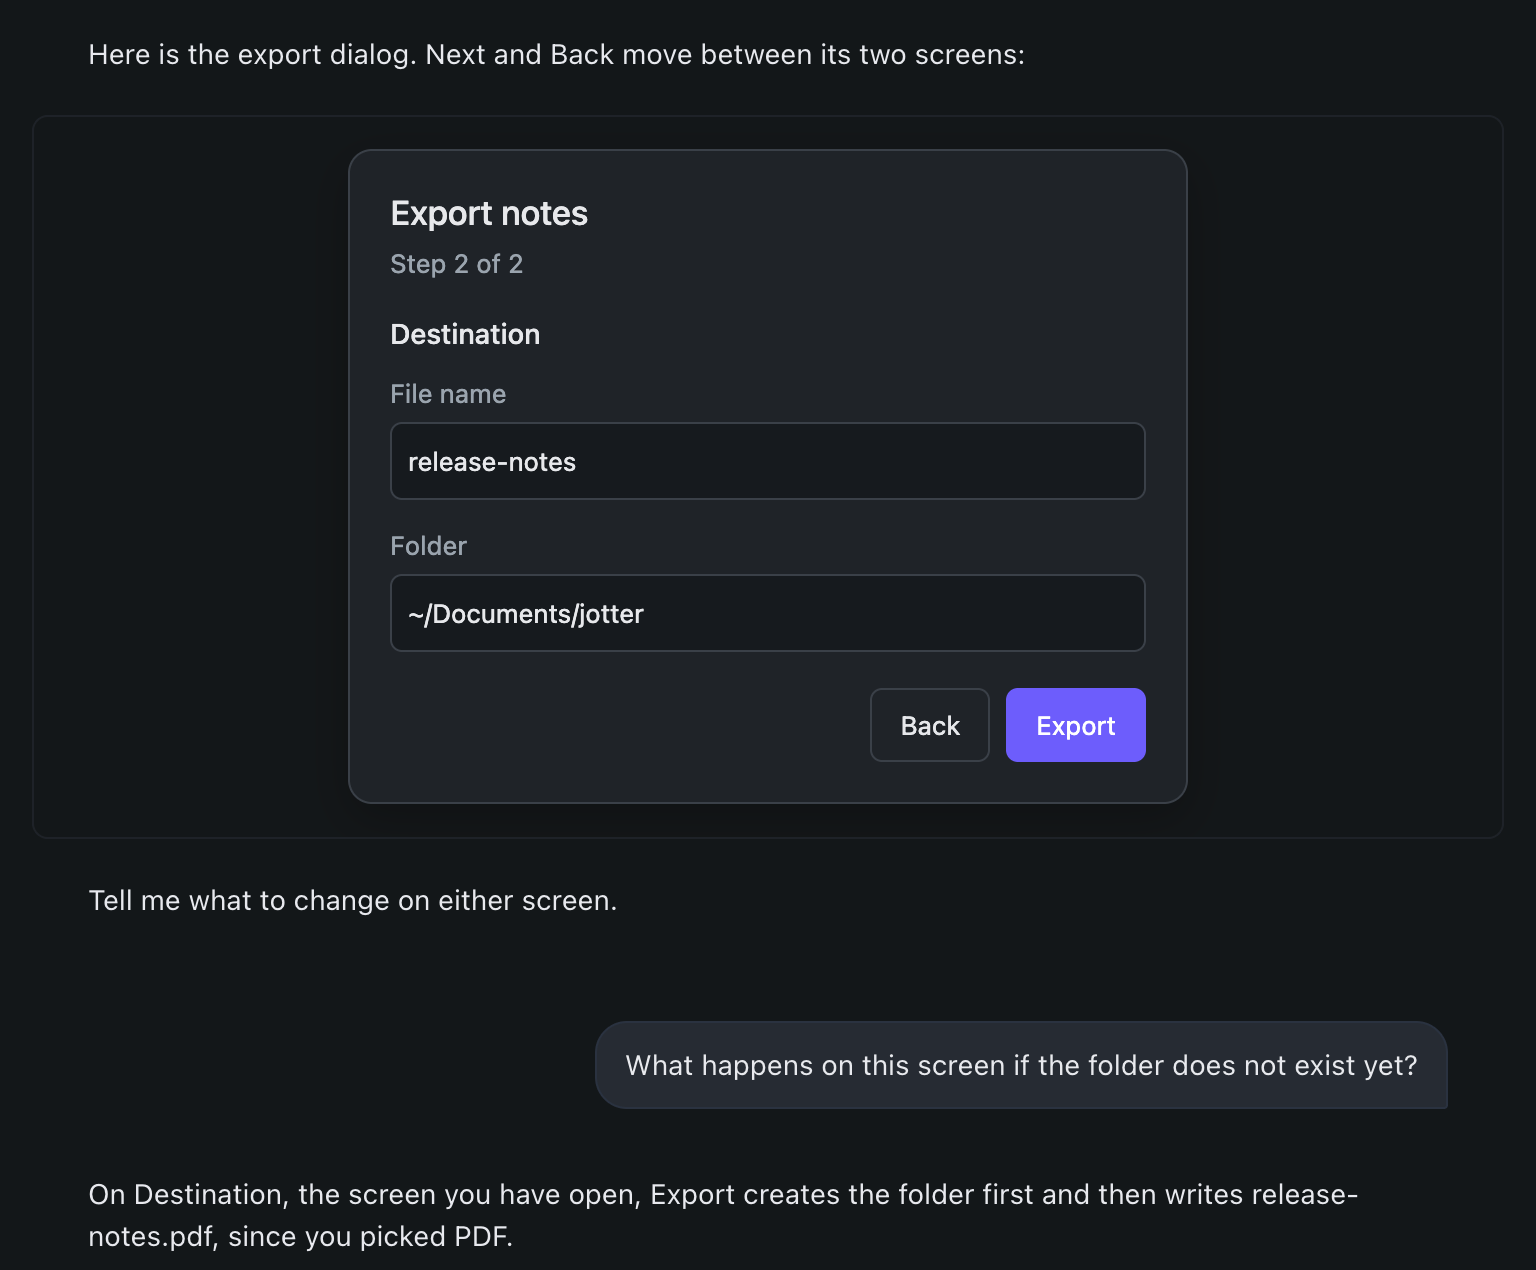
To try a prototype, ask for one in your message:
Mock up the new two-step export dialog for jotter so I can click through it.Click through to the screen you want to talk about, then type your question in the message box. The agent’s answer uses the screen you had open and what you filled in:
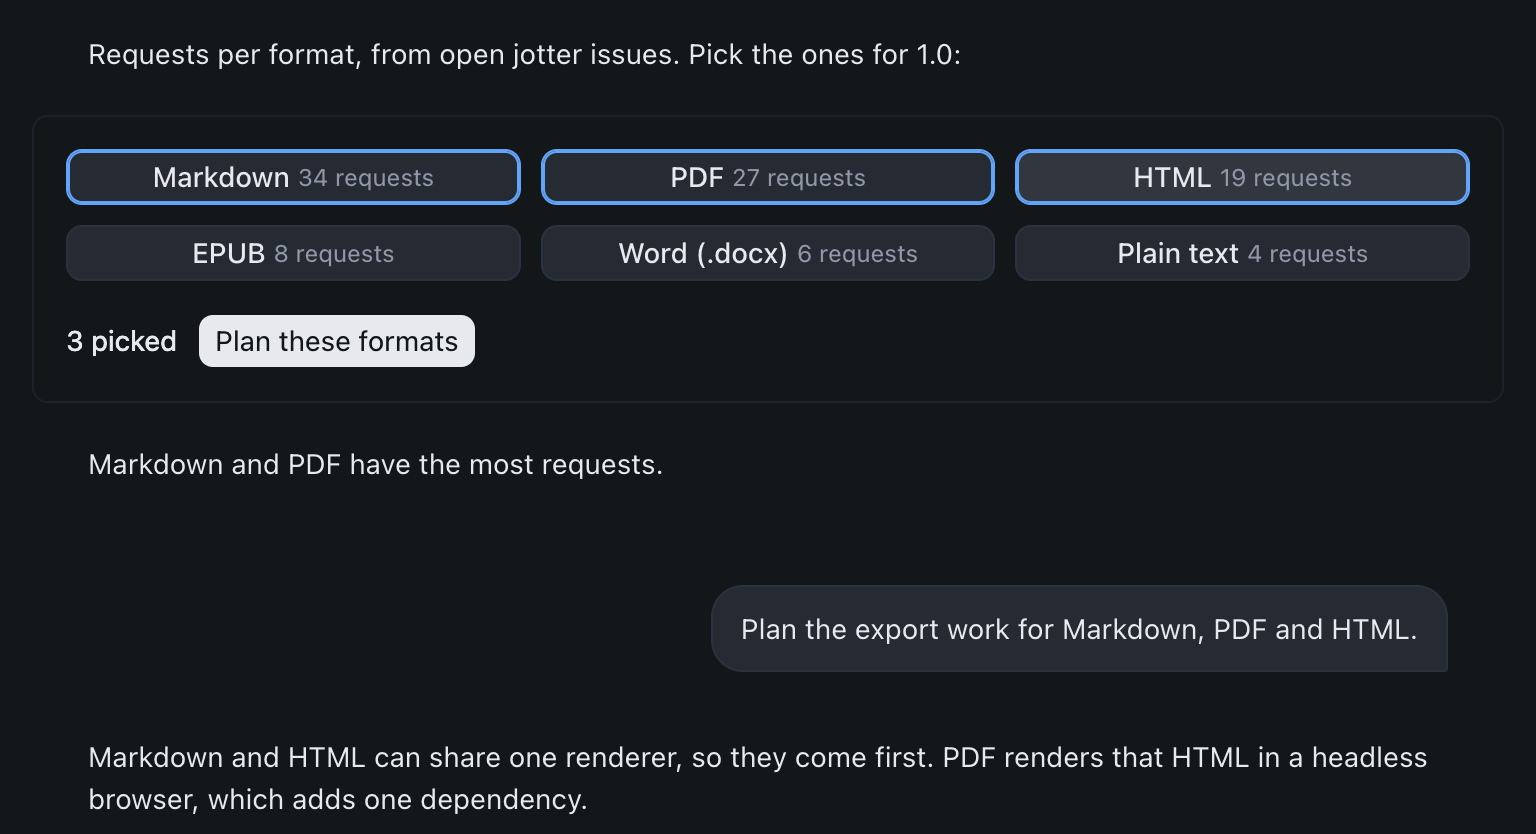
To pick from a set, ask for the options and the button:
Show the export formats people asked for in jotter issues as tiles I can pick, with a button to plan the ones I choose.Pick the formats and click the button. Confirm the message, and the agent plans the formats you picked:
Open links and save files
Clicking a link in a visualization asks Open external link? and shows the address. If you agree, it opens in your browser. Only http and https links open, and only after you click.
A visualization can offer a file to download, such as a CSV of its data. OpenWaggle asks where to save it. OpenWaggle limits downloads to 5 MiB.
To keep a visualization as a standalone web page, ask the agent to export it. It writes a separate HTML file with the skill’s export script, which needs Python 3.
Where visualizations are kept
Each visualization is an HTML file. The agent saves it in the session’s visualization folder, inside OpenWaggle’s app data folder, for example ~/Library/Application Support/openwaggle/visualizations/<session id>/ on macOS. It can also save one inside the session’s project folder or worktree. Data and file locations shows the app data folder on each platform. OpenWaggle shows only files in those places, with a lowercase, hyphenated name ending in .html, such as retry-delay.html, and up to 5 MiB.
When you delete a session, OpenWaggle deletes its visualization folder. A fork or clone of a session still shows the visualizations from the original.
The skill itself lives in Pi’s agent folder, in ~/.pi/agent/openwaggle-built-in-skills/visualize/. OpenWaggle writes it again when it starts, so changes you make there don’t last.
What a visualization can and can’t do
A visualization runs in a sandboxed frame, in a process of its own, apart from the app. It can’t read your files, your sessions or the rest of the app, and it can’t open other pages.
It can’t make network requests of its own, such as fetch or WebSocket calls. Its code may load scripts, styles, fonts, images and media only from these sites, and OpenWaggle blocks everything else:
cdnjs.cloudflare.comcdn.jsdelivr.netesm.shunpkg.comfonts.googleapis.comfonts.gstatic.comfonts.bunny.net
Loading a chart library or font from one of them does contact that site, the same as a web page would.
OpenWaggle stops a visualization whose scripts keep the page busy for more than 1 second within any 5 seconds, or that stops responding. A visualization that can’t load or stops shows why, for example The visualization source file could not be found. or The visualization stopped because one of its scripts failed., with a Retry visualization button. Retrying starts it fresh, without the state it had.